Data
Contents
Data
Data from simulations performed by McStasScript is returned as McStasData objects. This section will explore what these contain and how one can manipulate them. First a small instrument is written that will supply data to investigate.
Example instrument
The instrument will consist of a source, a powder sample and some monitors that will record data.
import mcstasscript as ms

instrument = ms.McStas_instr("data_example")

source = instrument.add_component("source", "Source_simple")
source.set_parameters(xwidth=0.05, yheight=0.03, dlambda=0.1,
                      dist=5, focus_xw=0.015, focus_yh=0.03)
source.lambda0 = instrument.add_parameter("wavelength", value=1.2)

sample = instrument.add_component("sample", "PowderN")
sample.set_parameters(radius=source.focus_xw, yheight=source.focus_yh,
                      reflections='"Na2Ca3Al2F14.laz"', barns=0)
sample.set_AT(source.dist, RELATIVE=source)
Example monitors
Here three monitors are defined, a 2D PSD monitor, a 1D banana monitor and an event monitor. Monitor_nD is used for the last two, where the option string describes the geometry and what is to be recorded.
banana = instrument.add_component("banana", "Monitor_nD", RELATIVE=sample)
banana.set_parameters(xwidth=1.5, yheight=0.4, restore_neutron=1, filename='"banana.dat"')
banana.options = '"theta limits=[5 175] bins=250, banana"'
event = instrument.add_component("events", "Monitor_nD")
event.set_AT(0.1, RELATIVE=sample)
event.set_parameters(xwidth=0.1, yheight=0.1, restore_neutron=1, filename='"events.dat"')
event.options = '"list all auto, x y z vx vy vz t"'
mon = instrument.add_component("PSD", "PSD_monitor")
mon.set_AT(0.1, RELATIVE=sample)
mon.set_parameters(nx=100, ny=100, filename='"psd.dat"',
                   xwidth=3*sample.radius, yheight=2*sample.yheight, restore_neutron=1)
Generating data
The simulation is executed using the backengine method with a low number of neutrons. The data is returned by the backengine method, but will contain None if the simulation failed.
instrument.settings(ncount=1E5, output_path="data_example")
data = instrument.backengine()
---- Found 1 places in McStas output with keyword 'error'.

         (negative time, miss next components, rounding errors, Nan, Inf).
Opening input file '/Applications/McStas-2.7.1.app/Contents/Resources/mcstas/2.7.1//data/Na2Ca3Al2F14.laz' (Table_Read_Offset)
Table from file 'Na2Ca3Al2F14.laz' (block 1) is 841 x 18 (x=1:20), constant step. interpolation: linear
  '# TITLE *-Na2Ca3Al2F14-[I213] Courbion, G.;Ferey, G.[1988] Standard NAC cal ...'
PowderN: sample: Reading 841 rows from Na2Ca3Al2F14.laz
PowderN: sample: Powder file probably of type Lazy Pulver (laz)
WARNING: but F2 unit is set to barns=0 (fm^2). Intensity might be 100 times too low.
PowderN: sample: Read 841 reflections from file 'Na2Ca3Al2F14.laz'
PowderN: sample: Vc=1079.1 [Angs] sigma_abs=11.7856 [barn] sigma_inc=13.6704 [barn] reflections=Na2Ca3Al2F14.laz
Detector: banana_I=3.0562e-07 banana_ERR=7.20103e-09 banana_N=13266 "banana.dat"
----------------------------------------------------------------------

INFO: Using directory: "/Users/madsbertelsen/PaNOSC/McStasScript/github/McStasScript/docs/source/user_guide/data_example_24"
INFO: Regenerating c-file: data_example.c
CFLAGS=
      INFO: Recompiling: ./data_example.out
mccode-r.c:2837:3: warning: expression result unused [-Wunused-value]
  *t0;
  ^~~
1 warning generated.
INFO: ===
Warning: 55239 events were removed in Component[5] PSD=PSD_monitor()
         (negative time, miss next components, rounding errors, Nan, Inf).
Opening input file '/Applications/McStas-2.7.1.app/Contents/Resources/mcstas/2.7.1//data/Na2Ca3Al2F14.laz' (Table_Read_Offset)
Table from file 'Na2Ca3Al2F14.laz' (block 1) is 841 x 18 (x=1:20), constant step. interpolation: linear
  '# TITLE *-Na2Ca3Al2F14-[I213] Courbion, G.;Ferey, G.[1988] Standard NAC cal ...'
PowderN: sample: Reading 841 rows from Na2Ca3Al2F14.laz
PowderN: sample: Powder file probably of type Lazy Pulver (laz)
WARNING: but F2 unit is set to barns=0 (fm^2). Intensity might be 100 times too low.
PowderN: sample: Read 841 reflections from file 'Na2Ca3Al2F14.laz'
PowderN: sample: Vc=1079.1 [Angs] sigma_abs=11.7856 [barn] sigma_inc=13.6704 [barn] reflections=Na2Ca3Al2F14.laz
Detector: banana_I=3.0562e-07 banana_ERR=7.20103e-09 banana_N=13266 "banana.dat"
Events:   "events_dat_list.p.x.y.z.vx.vy.vz.t"
Detector: PSD_I=5.15866e-05 PSD_ERR=5.11751e-07 PSD_N=10727 "psd.dat"
PowderN: sample: Info: you may highly improve the computation efficiency by using
    SPLIT 504 COMPONENT sample=PowderN(...)
  in the instrument description data_example.instr.
INFO: Placing instr file copy data_example.instr in dataset /Users/madsbertelsen/PaNOSC/McStasScript/github/McStasScript/docs/source/user_guide/data_example_24
loading system configuration
print(data)
[
McStasData: banana type: 1D  I:3.0562e-07 E:7.20103e-09 N:13266.0,
McStasDataEvent: events with 12663 events. Variables: p x y z vx vy vz t,
McStasData: PSD type: 2D  I:5.15866e-05 E:5.11751e-07 N:10727.0]
McStasData objects
The data retrieved from the instrument object is in the form of a list that contains McStasDataBinned and McStasDataEvent objects. McStasScript contains a function called name_search which can be used to select a certain element of such a data list. It will match the component name first and if no match is found it will check for match with the filename. Here name_search is used to retrieve the PSD McStasDataBinned object.
PSD = ms.name_search("PSD", data)
banana = ms.name_search("banana", data)
events = ms.name_search("events", data)
Accessing metadata
Both McStasDataBinned and McStasDataEvent object carries relevant metadata in a metadata attribute. Using the python print function this object can display basic information on the contained data.
print(PSD.metadata)
print(banana.metadata)
print(events.metadata)
metadata object
component_name: PSD
filename: psd.dat
2D data of dimension (100, 100)
  [-2.25: 2.25] X position [cm]
  [-3.0: 3.0] Y position [cm]
Instrument parameters:
 wavelength = 1.2

metadata object
component_name: banana
filename: banana.dat
1D data of length 250
  [5.0: 175.0] Longitude [deg]
 Intensity [n/s/bin]
Instrument parameters:
 wavelength = 1.2

metadata object
component_name: events
filename: events_dat_list.p.x.y.z.vx.vy.vz.t
2D data of dimension (8, 12663)
  [1.0: 12663.0] List of neutron events
  [1.0: 8.0] p x y z vx vy vz t
Instrument parameters:
 wavelength = 1.2
The metadata object has attributes which can be accessed as well. The info attribute is a dict with the raw metadata read from the file.
component_name
dimension
filename
limits
parameters
info
PSD.metadata.info
{'Date': 'Tue Apr 25 15:09:00 2023 (1682428140)',
 'type': 'array_2d(100, 100)',
 'Source': 'data_example (data_example.instr)',
 'component': 'PSD',
 'position': '0 0 5.1',
 'title': 'PSD monitor',
 'Ncount': '100000',
 'filename': 'psd.dat',
 'statistics': 'X0=0.002428; dX=0.443815; Y0=0.00465679; dY=0.888172;',
 'signal': 'Min=0; Max=7.12755e-08; Mean=5.15866e-09;',
 'values': '5.15866e-05 5.11751e-07 10727',
 'xvar': 'X',
 'yvar': 'Y',
 'xlabel': 'X position [cm]',
 'ylabel': 'Y position [cm]',
 'zvar': 'I',
 'zlabel': 'Signal per bin',
 'xylimits': '-2.25 2.25 -3 3',
 'variables': 'I I_err N',
 'Parameters': {'wavelength': 1.2}}
The total intensity, error or ncount is kept in the values are often of interest, so these are given their own attributes: total_I, total_E and total_N
print(PSD.metadata.total_I)
print(PSD.metadata.total_E)
print(PSD.metadata.total_N)
5.15866e-05
5.11751e-07
10727.0
Accessing the data
McStasData objects stores the data as Numpy arrays, these can be accessed as attributes.
Intensity: Holds the intensity, sum of all ray weights
Error: Error on intensity
Ncount: Number of rays that reached
print("Intensity")
print(PSD.Intensity)

print("Error")
print(PSD.Error)

print("Ncount")
print(PSD.Ncount)
Intensity
[[0.00000000e+00 0.00000000e+00 0.00000000e+00 ... 0.00000000e+00
  0.00000000e+00 0.00000000e+00]
 [0.00000000e+00 0.00000000e+00 0.00000000e+00 ... 0.00000000e+00
  0.00000000e+00 0.00000000e+00]
 [0.00000000e+00 0.00000000e+00 0.00000000e+00 ... 0.00000000e+00
  0.00000000e+00 0.00000000e+00]
 ...
 [0.00000000e+00 0.00000000e+00 0.00000000e+00 ... 0.00000000e+00
  0.00000000e+00 0.00000000e+00]
 [0.00000000e+00 0.00000000e+00 0.00000000e+00 ... 0.00000000e+00
  0.00000000e+00 0.00000000e+00]
 [0.00000000e+00 0.00000000e+00 0.00000000e+00 ... 0.00000000e+00
  0.00000000e+00 2.80231521e-13]]
Error
[[0.00000000e+00 0.00000000e+00 0.00000000e+00 ... 0.00000000e+00
  0.00000000e+00 0.00000000e+00]
 [0.00000000e+00 0.00000000e+00 0.00000000e+00 ... 0.00000000e+00
  0.00000000e+00 0.00000000e+00]
 [0.00000000e+00 0.00000000e+00 0.00000000e+00 ... 0.00000000e+00
  0.00000000e+00 0.00000000e+00]
 ...
 [0.00000000e+00 0.00000000e+00 0.00000000e+00 ... 0.00000000e+00
  0.00000000e+00 0.00000000e+00]
 [0.00000000e+00 0.00000000e+00 0.00000000e+00 ... 0.00000000e+00
  0.00000000e+00 0.00000000e+00]
 [0.00000000e+00 0.00000000e+00 0.00000000e+00 ... 0.00000000e+00
  0.00000000e+00 2.80231521e-13]]
Ncount
[[0. 0. 0. ... 0. 0. 0.]
 [0. 0. 0. ... 0. 0. 0.]
 [0. 0. 0. ... 0. 0. 0.]
 ...
 [0. 0. 0. ... 0. 0. 0.]
 [0. 0. 0. ... 0. 0. 0.]
 [0. 0. 0. ... 0. 0. 1.]]
The original path to the data is also contained within the McStasData object and can be returned with get_data_location.
PSD.get_data_location()
'/Users/madsbertelsen/PaNOSC/McStasScript/github/McStasScript/docs/source/user_guide/data_example_24'
Event data
McStasDataEvent objecst stores event data, and for this reason does not have Error or Ncount. The event information is contained in a 2D Numpy array in the Intensity and Events attributes.
print(events)
McStasDataEvent: events with 12663 events. Variables: p x y z vx vy vz t
print("Events", events.Events)
Events
 [[ 5.09588605e-09 -5.33771955e-03 -1.53182787e-03 ...  5.38993979e+00
   3.49550936e+03  1.45901483e-03]
 [ 5.08678487e-09 -6.85120636e-03  1.13122902e-02 ...  1.47617606e+01
   3.08444065e+03  1.65346025e-03]
 [ 5.11017231e-09  7.35062411e-03 -2.02235907e-04 ... -5.54492459e+00
   3.38583623e+03  1.50627486e-03]
 ...
 [ 5.09738461e-09 -6.71193243e-03 -5.38265271e-03 ...  5.84265279e+00
   3.14228617e+03  1.62302213e-03]
 [ 5.07013281e-09  3.78763833e-03 -1.01156338e-02 ... -1.27565580e+01
   3.10068899e+03  1.64479573e-03]
 [ 5.08555057e-09  5.31290127e-03 -4.74436200e-03 ... -4.16661389e+00
   3.20236321e+03  1.59257388e-03]]
The McStasDataEvent objects have some help functions to work with the contained event data. The first is get_data_column that returns the data for a given axis. The available axis shown in the table below.
Axis string |
Full name |
Unit |
Description |
|---|---|---|---|
t |
time |
s |
Particle time |
x |
x position |
m |
Coordinate x of particle |
y |
y position |
m |
Coordinate y of particle |
z |
z position |
m |
Coordinate z of particle |
vx |
x velocity |
m/s |
Velocity projected onto x |
vy |
y velocity |
m/s |
Velocity projected onto y |
vz |
z velocity |
m/s |
Velocity projected onto z |
p |
weight |
intensity |
Particle weight McStas n/s |
l |
lambda |
AA |
Wavelength |
e |
energy |
meV |
Particle energy |
speed |
speed |
m/s |
Speed (length of velocity vector) |
dx |
x divergence |
deg |
Divergence from z axis along x axis |
dy |
y divergence |
deg |
Divergence from z axis along y axis |
U1 |
User1 |
Userdefined |
User defined flag in Monitor_nD |
U2 |
User2 |
Userdefined |
User defined flag in Monitor_nD |
U3 |
User3 |
Userdefined |
User defined flag in Monitor_nD |
Here we get the wavelength information for each neutron in the event dataset.
events.get_data_column("l")
array([1.13174272, 1.28254125, 1.16840514, ..., 1.25896009, 1.27583808,
       1.23534237])
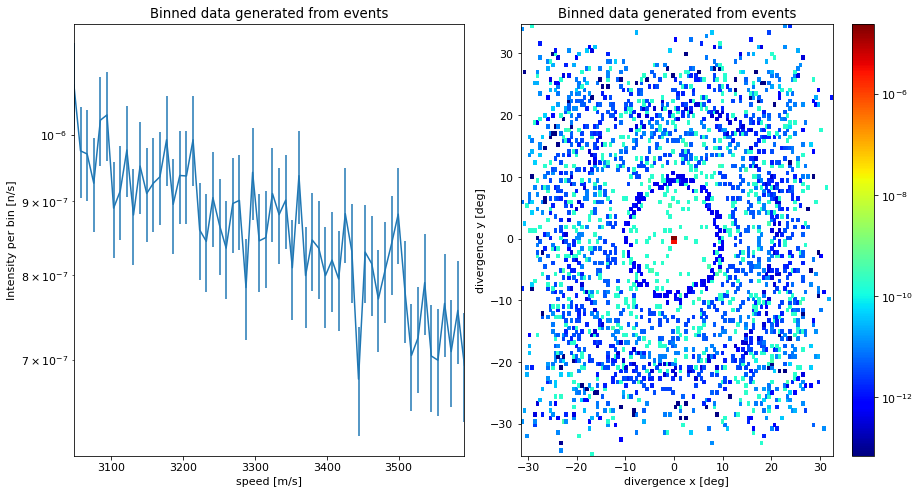
It is also possible to produce a McStasDataBinned dataset from a McStasDataEvent dataset by binning along one or two chosen dimensions using make_1d and make_2d. It supports all the same variables as above. For each method it is possible to choose how many bins should be used with the n_bins keyword argument.
speed_1d = events.make_1d("speed", n_bins=60)
divergence_2d = events.make_2d("dx", "dy", n_bins=[120, 120])

print(speed_1d)
print(divergence_2d)
McStasData: events type: 1D  I:5.16738177475073e-05 E:5.117640068605242e-07 N:12663
McStasData: events type: 2D  I:5.1673817747507206e-05 E:5.117640068605242e-07 N:12663.0
Plotting
McStasData objects contain information on how the data should be plotted, including for example if it should be on a logarithmic axis. This information is contained in the plot_options attribute of a McStasData object. The plotting are described in more detail on the plotting page.
PSD.plot_options
plot_options log: False
 colormap: jet
 show_colorbar: True
 cut_min: 0
 cut_max: 1
 x_limit_multiplier: 1
 y_limit_multiplier: 1
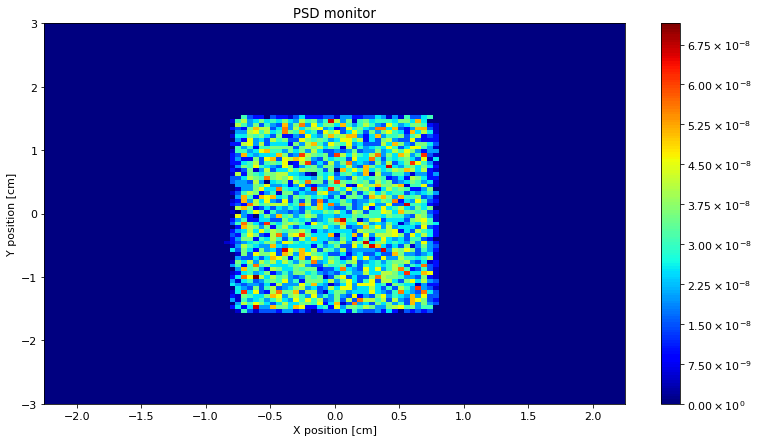
McStasScript can plot a McStasData object directly using for example make_plot.
ms.make_plot(PSD)
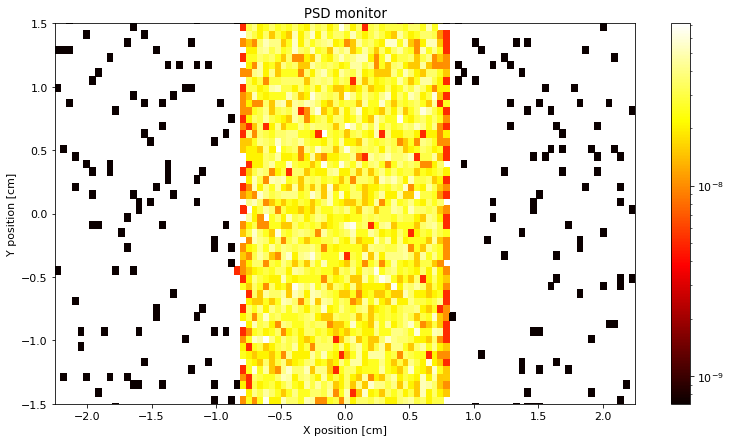
The plot_options can be updated with set_plot_options that takes keyword arguments.
PSD.set_plot_options(log=True, top_lim=1.5, bottom_lim=-1.5, colormap="hot", orders_of_mag=2)
ms.make_plot(PSD)
The set_plot_options takes the following keyword arguments. Some will only apply for 2D data, for example orders_of_mag.
Keyword argument |
Type |
Default |
Description |
|---|---|---|---|
log |
bool |
False |
Logarithmic axis for y in 1D or z in 2D |
orders_of_mag |
float |
300 |
Maximum orders of magnitude to plot in 2D |
colormap |
str |
“jet” |
Matplotlib colormap to use |
show_colorbar |
bool |
True |
Show the colorbar |
x_axis_multiplier |
float |
1 |
Multiplier for x axis data |
y_axis_multiplier |
float |
1 |
Multiplier for y axis data |
cut_min |
float |
0 |
Unitless lower limit normalized to data range |
cut_max |
float |
1 |
Unitless upper limit normalized to data range |
left_lim |
float |
Lower limit to plot range of x axis |
|
right_lim |
float |
Upper limit to plot range of x axis |
|
bottom_lim |
float |
Lower limit to plot range of y axis |
|
top_lim |
float |
Upper limit to plot range of y axis |
McStasDataBinned generated from Event files can be plotted in the same manner.
ms.make_sub_plot([speed_1d, divergence_2d], log=True)